In contrast to anti-Refuge Rocky Flats activists, some anti-nuclear groups are not anti-science or conspiracy theory based. This exchange with a member of the San Luis Obispo Mothers for Peace (founded in 1969, before the Rocky Mountain Peace & Justice Center) concerned radiation data their group acquired (using the same bGeigie Nano Geiger-Muller data-logging radiation counter I used on Rocky Flats) during a visit to observe the loading of spent fuel canisters into storage facilities. The member posted the data file and some questions to the Safecast group (of which I am a member). Because the processing by Safecast of these log files can take some time, I replied and analyzed the data. (It had been several years since I had used the free geographical information services tool QGIS and its Safecast plugin for log analysis, so it took me a few days to complete the analysis. Our exchange is below.
On Nov 12, 2022, at 12:45 PM, [redact]Carole H carolehisasue@gmail.com[/redact] wrote:
I uploaded a log from about a year ago. A member of San Luis Obispo Mothers for Peace, a watchdog organization keeping an eye on Diablo Canyon Nuclear Plant (California’s last operating plant) who is also a member of the Decommissioning Engagement Panel went to the nuclear plant last year with my bGeigie monitor. The Decommissioning Engagement Panel was invited to observe canister loading at the ISFSI (spent fuel storage site). I am attaching the log in this message.
As they went near the canisters, the radiation levels went through the roof! She showed it to everyone there but PG&E, the operators of the plant, said it was “nothing to worry about because it was measuring a different kind of radiation? measurement? that didn’t have any meaning.” Does this make any sense? At the same time, they quickly shut down the tour and escorted everyone out of there.
I am thinking that there could have been a radiation leak from any one of the spent fuel canisters. They are made of 5/8 inch steel, sitting out there near the ocean, with corrosion issues. I am extremely concerned because California’s Governor Newsom has signed a bill to keep the plant operating beyond its agreed upon shutdown date of 2024 and 2025. The utility is in the process of re-starting its license renewal application.
What do you think? Do you have any suggestions on how I can find out if what PG&E staff said is correct or not? Sean Bonner suggested I reach out to you all.
A while later,PG&E held another tour of the ISFSI but this time, observers were not allowed onto the pad but invited to observe remotely through cameras on a TV screen in another building. Readings were normal for the many hours our people were there.
Although the log has been uploaded to the API Safecast site, it is still pending approval.
On Saturday, November 12, 2022 at 7:11:49 PM UTC-8 wood…@gmail.com wrote:
Dear Ms. [redact]Hisasue[/redact]
First, I think it’s great that you have DATA and appreciate that measurements can help clarify risk. This is exactly what Safecast was meant for. Not all anti-nuclear folks think quantitatively.
The bGeigie nano is calibrated using 137Cs (I believe) so that 334 counts per minute is 1 microSv/hour. The use of the units Sieverts (Sv) is appropriate because the bGN assumes it is measuring (very penetrating) gamma rays, which have a ‘relative biological effectiveness’ at producing tissue damage of 1, permitting one to go from energy deposited per kg of tissue (`Gray’ dose units) directly to effective dose in Sv, for an average human. Both Grays and Sieverts are units of dose, but Sv are used in most radiation risk calculations.
The bGN is usually deployed 1 meter above the ground, with the axis of the Geiger-Muller tube horizontal. Beyond the range of alpha particles (a couple of inches in air), the bGN is measuring cosmic rays and gamma rays from soil. Around the Rocky Flats, Colorado area, I have compared 4000-point logs and the radiation rate they yielded with much older published ‘pressurized ion chamber’ results over nearby areas and found very good agreement between the resulting background radiation rates. (This is significant because pressurized ion chambers respond much more uniformly to gamma rays of differing energies than do Geiger-Muller tubes such as the one used in the bGN.) Thus I believe bGN results and bGN calibration.
I have plotted the results from your log to show the ADER (`ambient dose equivalent [radiation] rate’), a well accepted measure, as a function of time. The first full-minute data occurs at the time stamp 2021-10-28T15:19:44Z, so that’s where the value of the x axis begins (with index 1). Each sample is 5 seconds after the previous one (or 5/3600 of an hour).
The peak radiation rate is about 2.25 microSv/h, with a background rate of about 0.108 microSv/h. [Around Rocky Flats, at higher altitudes—so more cosmic rays—and lots more radioactive minerals in the soil, the background rate is about 0.130 microSv/h.]. So, you clearly saw dose rates about 21 times above background. But, the question is: how intense is a dose rate of 2.25 microSv/h and what was your net dose?
Peak radiation rates at the boundary of the Fukushima Daiichi power station in 2011 were about 1.9 millisieverts per hour, about 1000 times higher than the peak rate (2.25 microSv/h) you measured. The numerics I did on your data show a background rate BEFORE your peak of about 0.106 microSv/h, 0.119 AFTER your peak. If we average before and after backgrounds (0.112 muSv/h) and subtract this from your measurements over the peak, I find an approximate excess dose of 0.655 microSv. For teaching purposes the ‘banana equivalent dose’—the radiation dose from ingesting an average banana, because some of its potassium is the radioisotope potassium 40—is taken to be 0.1 microSv. So your excess dose is about equal to eating 5.5 bananas.
(This is NOT meant to be patronizing; it’s offered since I’m not sure how intuitively you think about radiation doses and what’s big and what’s small.)
The peak radiation rate is about 2.25 microSv/h, with a background rate of about 0.108 microSv/h. [Around Rocky Flats, at higher altitudes—so more cosmic rays—and lots more radioactive minerals in the soil, the background rate is about 0.130 microSv/h.]. So, you clearly saw dose rates about 21 times above background. But, the question is: how intense is a dose rate of 2.25 microSv/h and what was your net dose?
the operators of the plant, said it was “nothing to worry about because it was measuring a different kind of radiation? measurement? that didn’t have any meaning.”
This IS patronizing, and annoying as hell. Spent fuel rods emit plenty of beta particles and probably quite a bit of alpha radiation, in addition to copious amounts of gamma rays. You can rest assured that the bGeigie Nano DOES detect both alphas and betas (because of its mica detector window), but don’t do a good job of accurately measuring them because alpha particles are stopped by a sheet of paper and betas by an inch or so of most materials, and wouldn’t (shouldn’t) make it through the 5/8 in steel casings. But high-energy gamma rays do.
Good for you for checking and not taking their word for it.
I hope this is useful to you and to your group.
Please let the mailing list know if you want to know more.
Thank you, David. I’ve sent it to our entire group. It’s a bit over my head, to be honest. I still think there was a radiation leak — maybe this is common during loading or unloading spent fuel…???
A ‘fuel leak’ means spent fuel (actual material) is getting out of a container, quite serious. A ‘radiation leak’ is another matter, since it takes lots of ‘shielding’ (such as lead or thick steel) to stop gamma rays. My guess is that any time old fuel rods are removed from their casing, the casing stops absorbing some of the gamma rays, leaving more to be detected and measured. I have a gamma ray spectrometer in my basement with 95 lbs of lead shot around it (maybe 2” thick), and I find that high energy gamma rays—just from natural potassium 40 in the soil, for example—easily cruise right on through, to be measured. So, there need not have been any leak of fuel for there to be more radiation during the fuel rod transfers.
‘Radiation’ is the emission of anything that leaves where the source is. Gamma rays are very different in behavior than alpha and beta particles, the latter two having a finite range in air or water, for example, since they are charged particles which can ionize gas or water molecules, thus rapidly losing all of their initial energy. Gamma rays are very high energy light, which have an infinite range in empty space (think: stars), although they are very attenuated (partly absorbed) when traversing dense matter (lead, steel).
There need not have been any radiation leak to explain the measurements, I’d say.
One useful takeaway is that just because radiation is *measureable* does not mean that it is *dangerous*. It’s all a matter of the DOSE. [As Paracelcus said long ago, “The dose makes the poison”.]
If your group wants more background on radiation and health, please let me know.
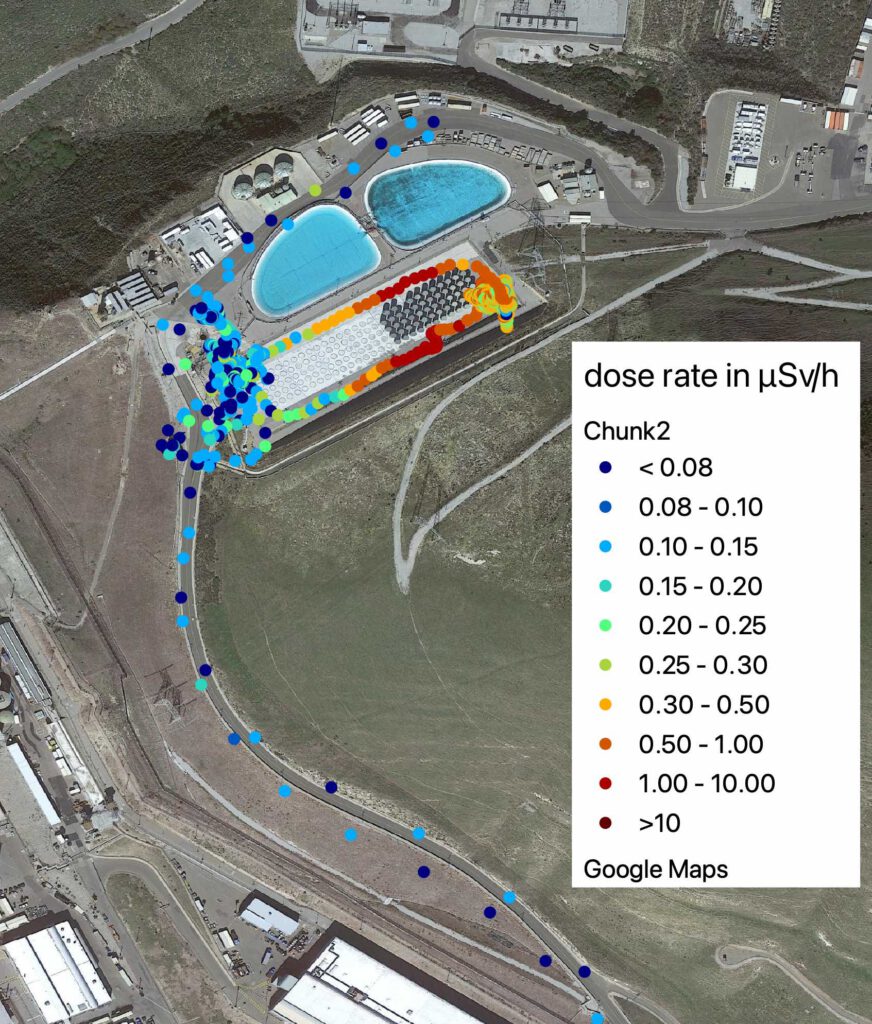
My last email on November 16, 2022 gives final results, and was followed by maps, one shown.
The Safecast project has encouraged software developers to support mapping software for quite a while. They have their own map services, obviously, if you visit their website. However, various Czech bGeigie Nano users began developing a ‘plugin’ for QGIS, a well known, free geographic information system (GIS) several years ago. For the last two years I have been unable to use the old plugin as I’ve gone through several operating system changes. However, in the last two days I’ve finally been able to get the plugin to (mostly) work, and have used it to process your data. QGIS itself has changed a lot since I last used it, so I’m fumbling around somewhat; the learning curve is very steep.
NOTE: I had not realized until the plugin analyzed your log file that there were in fact 3 separate logging sessions in it. This means that some assumptions I made in the ‘quick and dirty’ analysis I sent you were wrong. In fact, radiation doses are substantially LESS than what I quoted before. Here are the revised figures, for the three ‘chunks’ within your log file.
Chunk1: time stamped 15:19:09 through 17:12:29;
Chunk2: time stamped 17:43:49 through 20:59:36
Chunk3: time stamped 22:15:16 through 22:47:13
The total doses below INCLUDE the dose from background radiation, which as I mentioned earlier is about
Chunk1: 1:53:20 monitoring time, 2.66 km covered in total, max dose rate 0.395 microSv/h, avg dose rate 0.113 microSv/h, total dose 0.213 microSv. {my hand calc: 0.106 avg dose rate}
Chunk2: 3:15:47 monitoring time, 5.103 km covered in total, max dose rate 3.808 microSv/h, avg dose rate 0.319, total dose 1.038 microSv
Chunk3: 0:31:57 monitoring time, 0.492 km covered in total, max dose rate 0.323 microSv/h, av 0.130, total dose 0.059 microSv
{my hand calc: 0.119}
The effect of the different durations and jumps in time is to reduce the max dose rate from 2.25 microSv/h (my original value) to 1.038. The total dose to whoever was carrying the bGN was about (0.213+1.038+0.059) = 1.31 microSv. This is a higher dose than I estimated below, because the high dose rate was spread over a shorter time (Chunk 2), about 13 = 1.31/0.1 ‘banana equivalent doses’.
If you’re lucky, someone with more QGIS experience than I will take a shot at your log file, but I’m now quite confident about this report.
The maps are interesting. During the time between 12:15 and 12:36 or so the bGN was in a fairly hot area. Only ther person(s) who made the measurements knows what precisely was going on. The good news is that hot regions are not spread around, and dose rates rapidly approach background levels away from whatever was emitting gamma rays. I am puzzled by the fact that there are at least two pretty radioactive areas you all visited.
Noteworthy
- They did a measurement and decided to use real data to assess danger and risk
- Unsure of its meaning, they posted to a group of knowledgeable people rather than quoting hearsay
- Easily measurable dose rates do not imply a large dose. As noted in the correspondence, eating an average banana (lots of potassium–good for you–but containing the beta emitter 40K which also kicks out a high-energy gamma ray) gives you a radiation dose of 1 BED (banana equivalent dose), now standardized to 0.1 μSv. So this 3.26 hour excursion gave the measurer an excess dose (not due to background) of 0.673 μSv, equivalent to eating almost 7 bananas.
The message they got from the power company personnel did not inspire confidence. Although no alpha or beta radiation was present to be measured, the measured gamma radiation most certainly does have meaning, despite the low dose.