The message in graphics, Part I: Radiation levels and soil contributions, Properties of Pu, Measured Pu levels and computing radiation doses, Annual doses from Pu [click to go]
A brief explanatory paragraph is shown in blue and follows each gallery; in the right margin are footnotes for the interested.
Epidemiology for people living around Rocky Flats
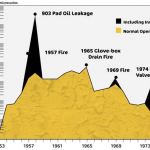
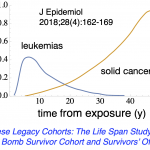
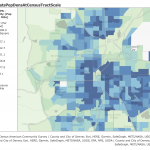
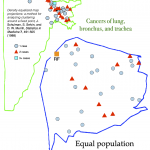
[ABOVE} Historical releases from Rocky Flats and expected and detected typical cancer: Given the history of radiation releases and the 'incubation time' for cancers to emerge post-exposure, by 1987 a readily measured number of leukemias (and probably many solid cancers) should have emerged if Pu exposure had been significant. Note that cancer cases would appear to cluster where the population density is high, even if the cancer rate is uniform across an area. The population density around Rocky Flats is very non-uniform, so it is important to correct for this before searching for cancer clusters. When this is done (via a `cartogram', which distorts the area's shape in order to produce an area with constant population density everywhere, the cancer cases do not cluster (checked statistically), nor are there more nearer to Rocky Flats. Similar trends were found for several cancers expected if radiation exposure is significant. The CDPHE updates cancer statistics every few years.
The Superfund cleanup (finished 2005)
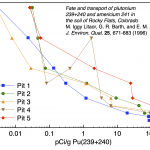
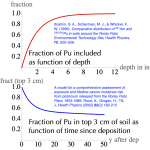
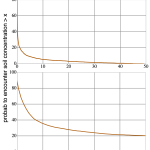
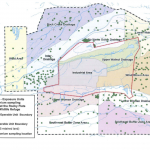
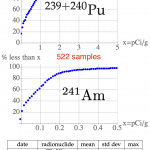
[ABOVE] Pre-cleanup sampling for pits in very contaminated parts of the Rocky Flats `Industrial Area' showed that by 3 feet deep Pu levels had dropped to 1/25,000 of their surface levels. Thus the cleanup scraped off and transported away the top 3 feet of soil in the industrial area. Pu levels were re-measured, and then the area was covered with 3 feet of clean topsoil. 90% of Pu is in the top 4 inches of soil. The agreed-upon limit for Pu in soil was 50 pCi/g, set well before it was appreciated that, in fact, levels were far below this. Note sampling locations and measured Pu concentrations post-cleanup (inside what is now the DOE-controlled `central operable unit') and in the Refuge. To the extent that sampling locations are representative, we replot the probability (walking randomly) you will encounter soil with Pu concentration above the x value (brown curves). IMPORTANT: Total soil radioactivity apart from Pu, Am is about 53.4 pCi/g.
Data for the Refuge
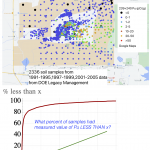
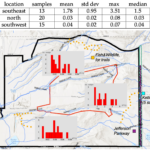
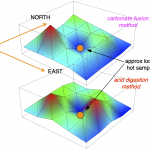
[ABOVE] The Refuge was never cleaned up, since it was lightly contaminated--far below the mandate of 50 pCi/g. It was nonetheless thoroughly sampled by the DOE, with some additional sampling by Fish&Wildlife in 2006 before conversion to a wildllife refuge, and then in 2019 for the Jefferson Parkway (already discussed), and for additions to the Rocky Mountain Greenway. The area immediately around the single hot particle found was carefully re-sampled. IMPORTANT: Total soil radioactivity apart from Pu, Am is about 53.4 pCi/g.
Claims of excess cancer risks downwind of Rocky Flats by Carl Johnson in 1981 were rapidly discredited for procedural errors and sloppiness.
The Downwinders survey of 2016 was a publicity stunt which yielded no insights except that if you're told to blame Rocky Flats for illnesses this is what you will believe. Two separate documents (Nov 2023: soon to be available) consider epidemiology and what has been found for areas around Rocky Flats.
Establishing the desired cleanup levels was a very contentious issue in the mid- to late-1990s. Eventually 50 pCi/g of soil was formally accepted (with protests from anti-nuclear groups).
