As of November 2024, quite a bit of construction related to the Rocky Mountain Greenway is going on: two Refuge-internal bridges and the flyover bridge that will connect Westminster open space with the Refuge. It will be a while before Fish&Wildlife Service maps are updated.
The maps below are intended for recreational users. One has QR codes which will fire up Google Maps and show you some of the lesser-known access points on the southern Refuge boundary. This map should be downloaded and printed–its resolution is high enough to read the QR codes with your cell phone camera.
- Trail map with southern access points as QR codes. [Full resolution version.] (Back side: a brief review of Refuge safety. QR codes there take you to pages on https://rockyflatsneighbors.org )
- Sampling points throughout Refuge
- Approximate contour map (pCi/g) together with trail maps and sampling locations.
- A close-up of the Refuge area near the Indiana St bridge.
Other maps, for those interested, show the locations of all soil sampling activities (from the DOE before [Refuge] and after [COU] the Superfund cleanup). Some maps have contours of constant Pu concentration (in pCi/g, to be compared with about 54 pCi/g from natural radioisotopes). Generally the contours are shown with all sampling points, to remind you that closely spaced contours are only really meaningful for closely-spaced sampling points. Generally all can be zoomed considerably without being too colossal.
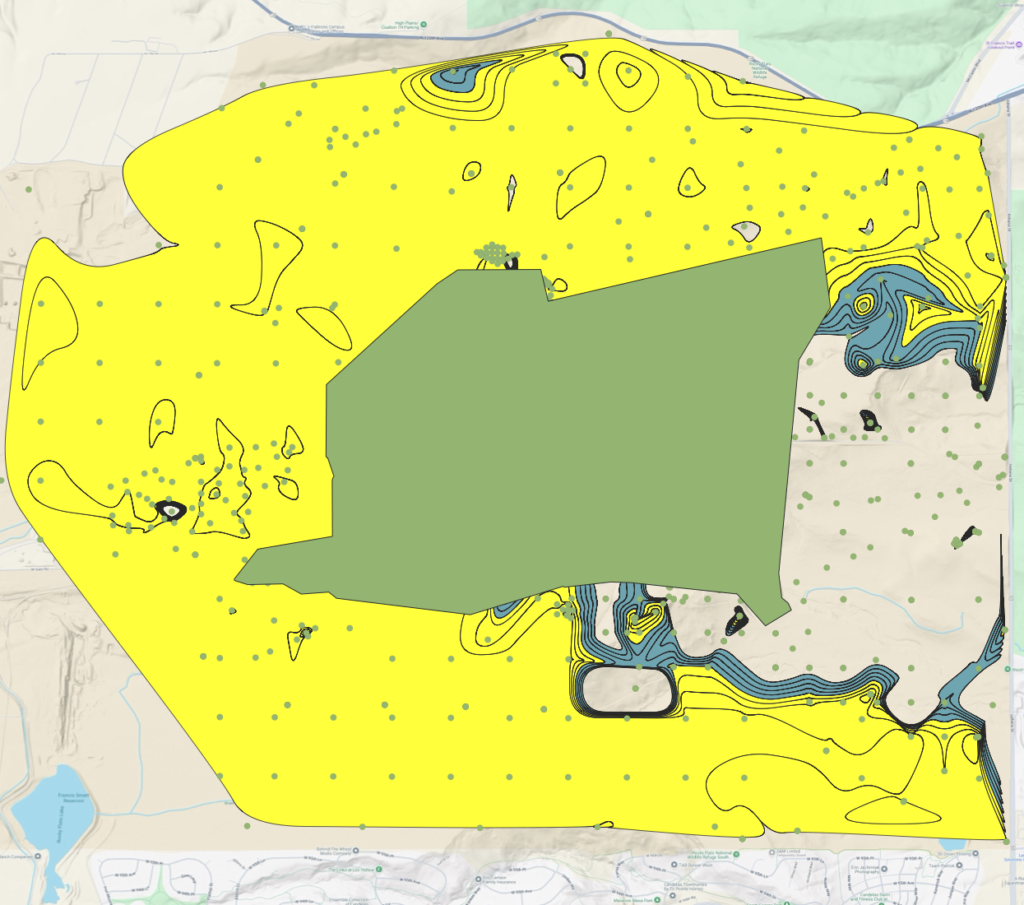
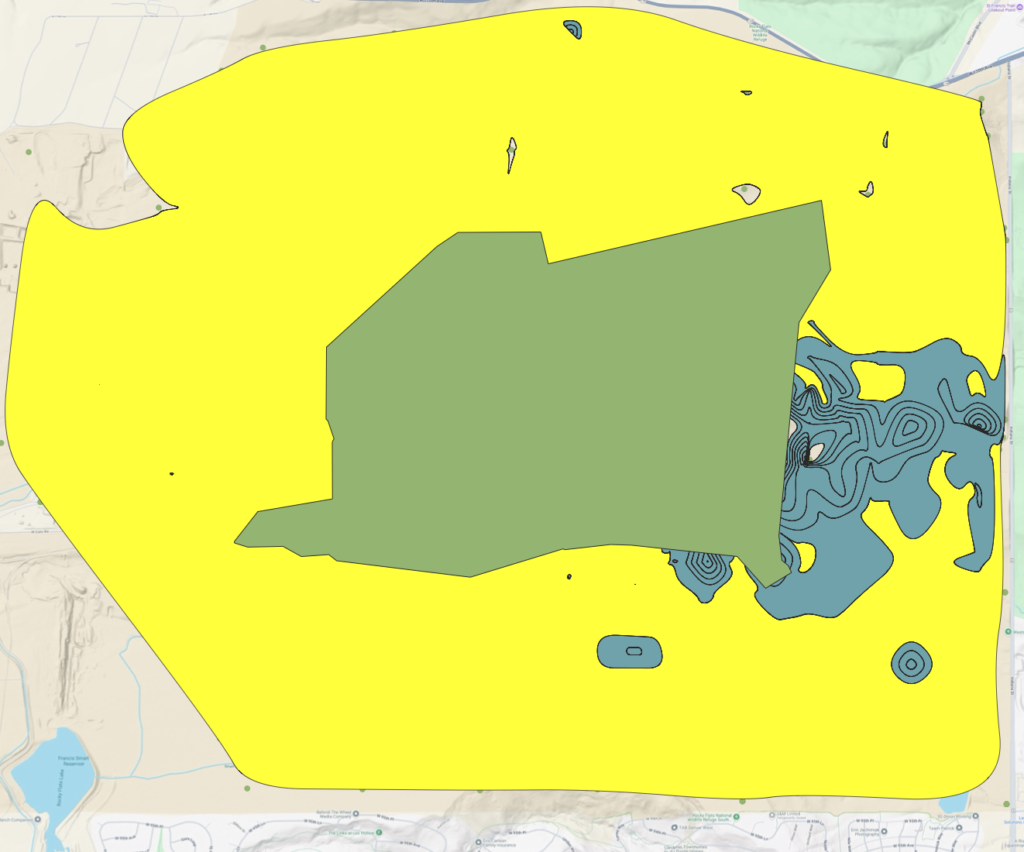
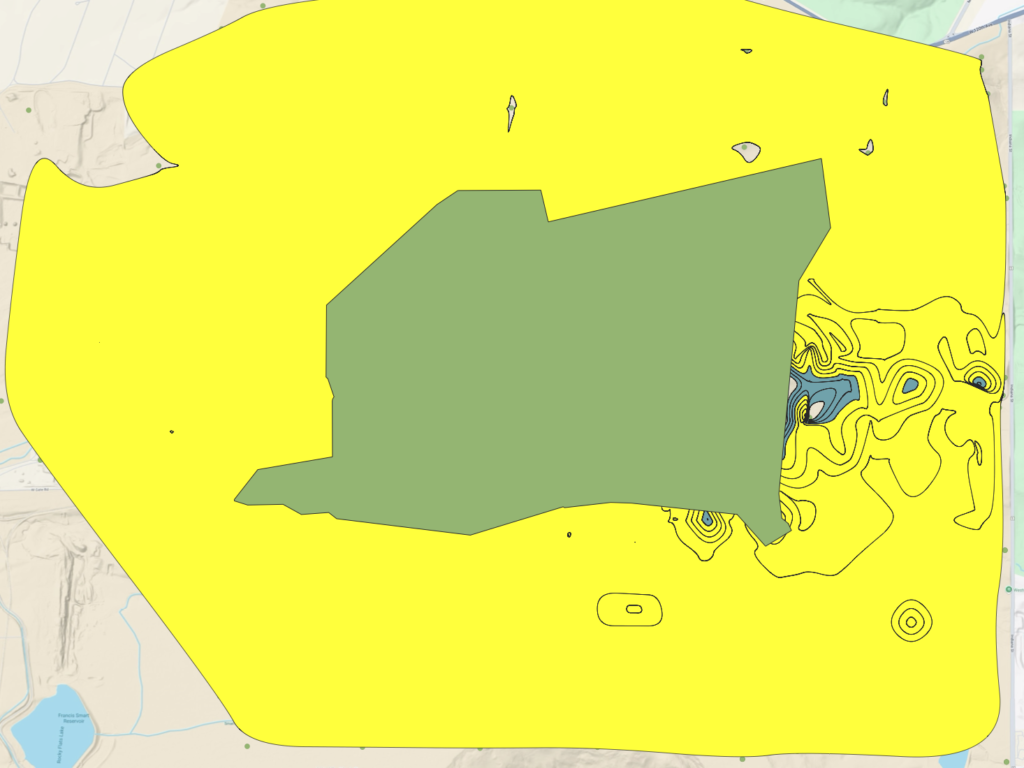
Want an overall view of Pu levels in the Refuge? See below–mouse over each image to see the caption. The DOE-controlled Central Operable Unit is the shaded donut hole.] Regions shaded in yellow show where the criterion holds–huge fractions of the Refuge have less than 0.5 pCi/g, 100 times smaller than the cleanup standard in the COU. Regions in gray-blue are outside this value, and blank areas are where outside the total range examined; dots are soil sampling points. Always bear in mind that NATURAL soil radioactivity around Rocky Flats is about 53 pCi/g. Within the COU, for your information, 80% of Pu samples are below 1 pCi/g.
As usual with contours, they are most reliable when there are many sampling points nearby. On the other hand, the regions are probably robust.
 Regions with 0.5 pCi/g or less
 Regions with 0-2 pCi/g
 Regions with less than 10 pCi/g